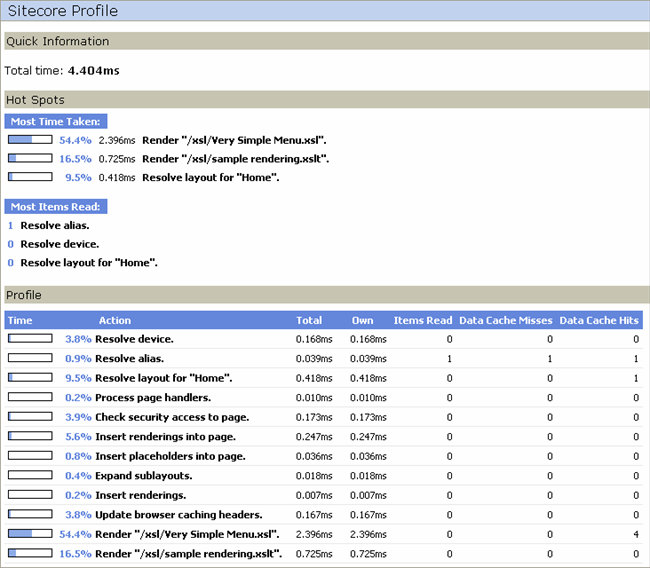
Sitecore Profile window provides the trace summary along with the cache usage information (see the picture above).
Quick Information
Indicates the total rendering time.
Hot Spots
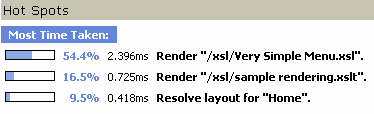
Indicates three actions which where the longest to execute.
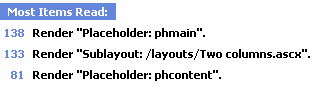
The Most Items Read section shows three actions which caused the biggest number of requests to other items.
1. The Profile
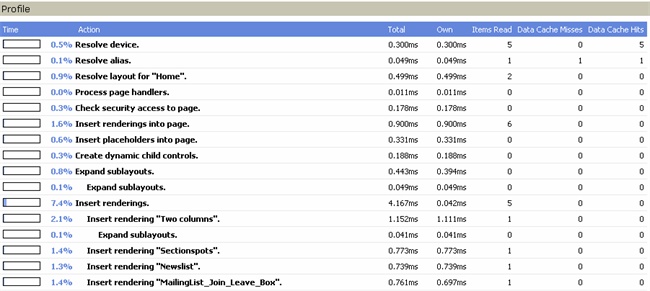
The Profile contains the summary of all actions executed during the rendering of the page and the cache hit rate. Below is the explanation of the Profile’s columns.
Time
The percentage of time required to render the entire page required to complete a particular action.
Action
A description of the particular action.
Total
The total execution time in milliseconds.
Own
The execution time of the item itself, not including the renderings triggered by it, in milliseconds.
Items Read
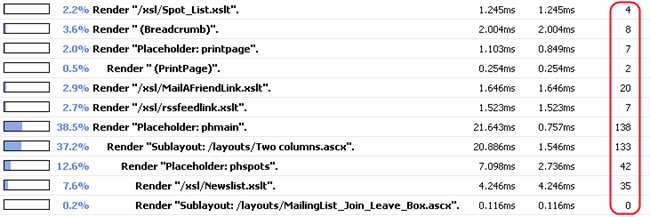
The number of Sitecore items read during the execution of a particular rendering. This information should give a hint why some rendering takes so long to execute or help to detect a non-working query.
Data Cache Misses
Indicates how many times the action was requested and not found in cache.
Data Cache Hits
Indicates how many times the action was requested and found in cache.